
Bloch sphere plots and animations
I’ll show how to plot the Bloch sphere in Python using Matplotlib. Then, I will show how to make basic animations.
Here are the final results
You can find all the code on my GitHub, run the file on Google Colab, or copy snipped of code below.
Bloch sphere setup
 We can import the standard visualisation packages and customise them for aesthetics.
%config InlineBackend.figure_format = "retina"
%matplotlib inline
import matplotlib
import matplotlib.pyplot as plt

from mpl_toolkits.mplot3d import Axes3D
from matplotlib import animation
from matplotlib import rcParams

rcParams["savefig.dpi"] = 100
rcParams["figure.figsize"] = [10, 5]
rcParams["figure.dpi"] = 100
rcParams["font.size"] = 14

import numpy as np
And now we set-up the blank canvas for a Bloch sphere
fig = plt.figure()
ax = fig.add_subplot(111, projection='3d')
ax.set_aspect("equal")


# Make data
r = 1
u = np.linspace(0, 2 * np.pi, 100)
v = np.linspace(0, np.pi, 100)
x = r * np.outer(np.cos(u), np.sin(v))
y = r * np.outer(np.sin(u), np.sin(v))
z = r * np.outer(np.ones(np.size(u)), np.cos(v))

# Plot the surface
ax.plot_surface(x, y, z, color='linen', alpha=0.2)

# plot circular curves over the surface
theta = np.linspace(0, 2 * np.pi, 100)
z = np.zeros(100)
x = r * np.sin(theta)
y = r * np.cos(theta)

ax.plot(x, y, z, color='black', alpha=0.50)
ax.plot(y, z, x, color='black', alpha=0.50)

## add axis lines
zeros = np.zeros(1000)
line = np.linspace(-r,r,1000)

ax.plot(line, zeros, zeros, color='black', alpha=0.50)
ax.plot(zeros, line, zeros, color='black', alpha=0.50)
ax.plot(zeros, zeros, line, color='black', alpha=0.50)

# draw a point
eps = 0.2
ax.text(1+eps,0,0,'$x$')
ax.text(0,1+eps,0,'$y$')
ax.text(0,0,1+eps,'$+z$')
ax.text(0,0,-1-eps,'$-z$')


ax.set_xlim3d(-1,1)
ax.set_ylim3d(-1,1)
ax.set_zlim3d(-1,1)


ax.set_axis_off()
ax.azim = 45

plt.show()
I like to wrap this code into a function that can be used repeatedly.
# Sets up the fig and ax for a Bloch sphere
def bloch_sphere():
    fig = plt.figure()
    ax = fig.add_subplot(111, projection='3d')
    ax.set_aspect("equal")


    # Make data
    r = 1
    u = np.linspace(0, 2 * np.pi, 100)
    v = np.linspace(0, np.pi, 100)
    x = r * np.outer(np.cos(u), np.sin(v))
    y = r * np.outer(np.sin(u), np.sin(v))
    z = r * np.outer(np.ones(np.size(u)), np.cos(v))

    # Plot the surface
    ax.plot_surface(x, y, z, color='linen', alpha=0.2)

    # plot circular curves over the surface
    theta = np.linspace(0, 2 * np.pi, 100)
    z = np.zeros(100)
    x = r * np.sin(theta)
    y = r * np.cos(theta)

    ax.plot(x, y, z, color='black', alpha=0.50)
    ax.plot(y, z, x, color='black', alpha=0.50)

    ## add axis lines
    zeros = np.zeros(1000)
    line = np.linspace(-r,r,1000)

    ax.plot(line, zeros, zeros, color='black', alpha=0.50)
    ax.plot(zeros, line, zeros, color='black', alpha=0.50)
    ax.plot(zeros, zeros, line, color='black', alpha=0.50)

    # draw a point
    eps = 0.2
    ax.text(1+eps,0,0,'$x$')
    ax.text(0,1+eps,0,'$y$')
    ax.text(0,0,1+eps,'$+z$')
    ax.text(0,0,-1-eps,'$-z$')


    ax.set_xlim3d(-1,1)
    ax.set_ylim3d(-1,1)
    ax.set_zlim3d(-1,1)


    ax.set_axis_off()
    ax.azim = 45

    return fig, ax
Drawing vectors
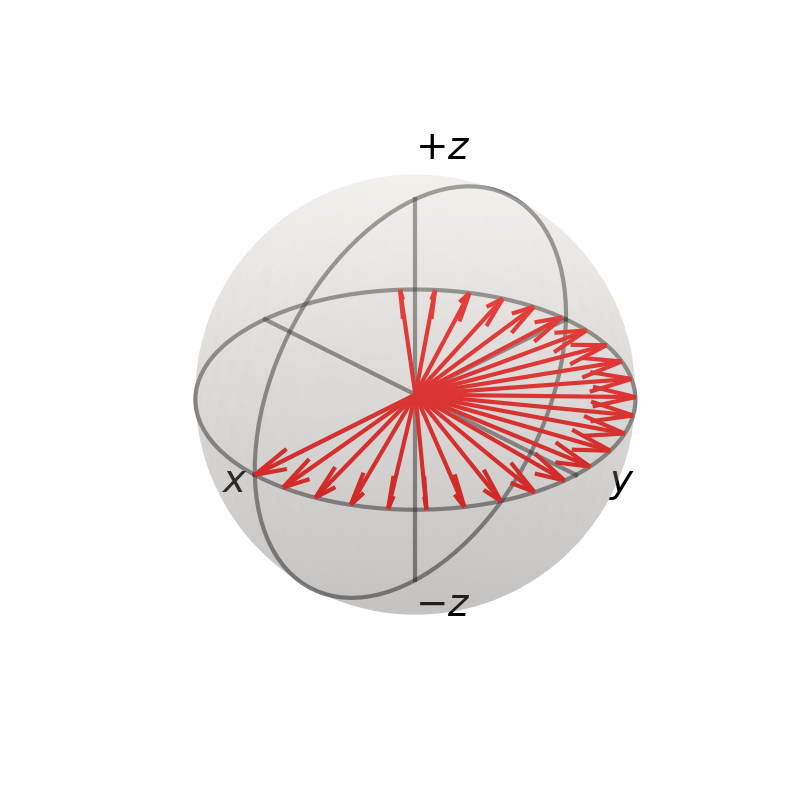
Now I can start adding vectors to it
# Let's draw some vectors

fig, ax = bloch_sphere()


N = 25 #number of arrows
thetas = np.linspace(0, 4, N) # parameterising the arrows
# heads of the arrows with adjusted arrow head length
bvecs = []
for i in range(len(thetas)):
    bvecs.append([np.cos(thetas[i]), np.sin(thetas[i]), 0])
bvecs = np.array(bvecs)

# tails of the arrows
tails= np.zeros(N)

ax.quiver(tails,tails,tails,bvecs[:,0], bvecs[:,1], bvecs[:,2], length=1.0, normalize=True, color='r', arrow_length_ratio=0.2)

plt.show()
Animating vectors
# Let's animate this

fig, ax = bloch_sphere()

N = 25 #number of arrows
thetas = np.linspace(0, 4, N) # parameterising the arrows
# heads of the arrows with adjusted arrow head length
bvecs = []
for i in range(len(thetas)):
    bvecs.append([np.cos(thetas[i]), np.sin(thetas[i]), 0])
bvecs = np.array(bvecs)

# tails of the arrows
tails= np.zeros(N)

def update(num):
    ax.quiver(tails[:num],tails[:num],tails[:num],bvecs[:num,0], bvecs[:num,1], bvecs[:num,2],
              length=1.0, normalize=True, color='r', arrow_length_ratio=0.2)

ani = animation.FuncAnimation(fig, update, N, interval=1000/N, blit=False)
ani.save('my_animation.gif')
plt.show()
Drawing points

# Let's draw some points

fig, ax = bloch_sphere()

N = 10 # number of points
thetas = np.linspace(0, 4, N)

# points on bloch sphere
points = []
for i in range(len(thetas)):
    points.append([np.cos(thetas[i]), np.sin(thetas[i]), 0])
points = np.array(points)

ax.scatter(points[:, 0], points[:, 1], points[:, 2], color='r')

plt.show()
Animating points

# Let's animate the points

fig, ax = bloch_sphere()

N = 10 # number of points
thetas = np.linspace(0, 4, N)

# points on bloch sphere
points = []
for i in range(len(thetas)):
    points.append([np.cos(thetas[i]), np.sin(thetas[i]), 0])
points = np.array(points)

def update(num):
    ax.scatter(points[:num, 0], points[:num, 1], points[:num, 2], color='r')

ani = animation.FuncAnimation(fig, update, N, interval=1000/N, blit=False)
ani.save('my_animation2.gif')
plt.show()